Instant Data Insights With Google Sheets Explore
Have you ever looked at a spreadsheet and wondered what to do with the data? This is where the Google Sheets Explore tool comes in handy!
What Does the Sheets Explore Tool Do?
When you’ve got some data in your sheet and you’re trying to figure out what to do with it, try clicking on the Explore Icon in the lower right.
![]()
Highlight some data and click on the Explore button to see how it pulls up some visualized data on the right.
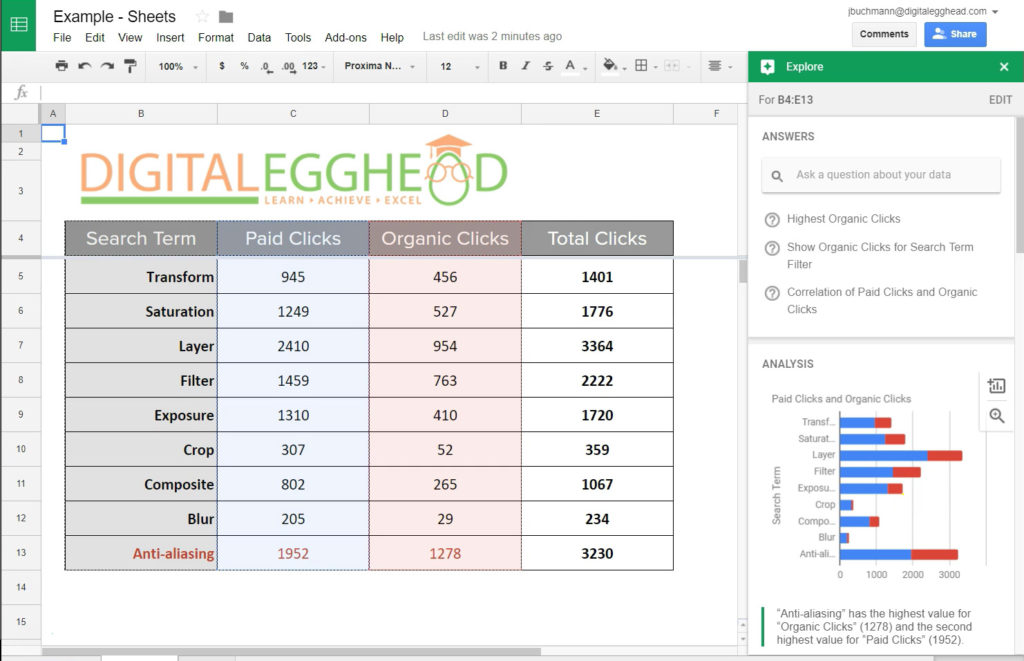
Scroll through this window to see all kinds of different charts and graphs created from your data. Below each chart and graph is a statement that tells you something about that data to help you understand it better.
Using the Data
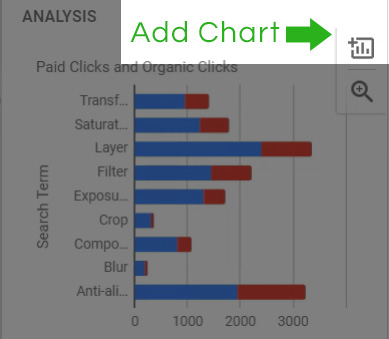
If you see a chart you like, you can click on the icon in the upper right of the chart to copy it into your sheet.
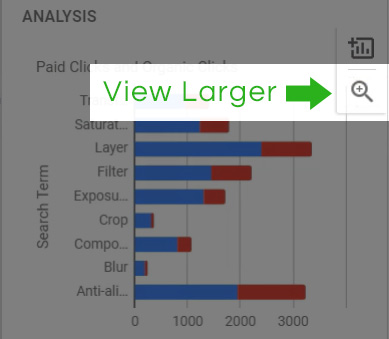
Or you can just view a larger version of it if you’d like.
You can also ask a question at the top of the window.
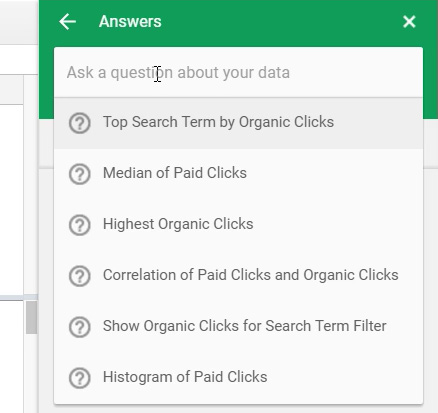
Once you click in the ‘ask a question’ box, you will see a list of suggested questions. You can choose one of these, or type in your own. If it’s a valid question, Sheets will display the results at the top of the window.
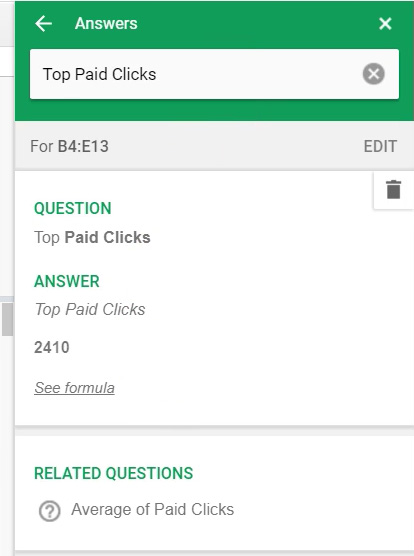
Quick Basic Function Results
You can see data for your sheet without any cells highlighted. If you do have cells highlighted, the top of the window will populate with some basic data regarding the selection. This example shows the Sum, Average, Min, Max, and Count of these cells without having to set up any functions.
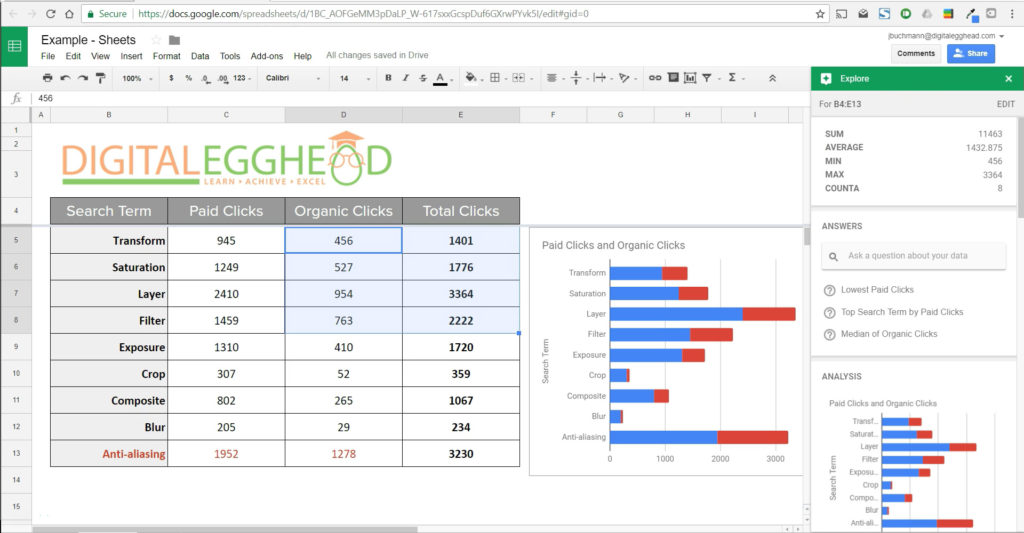
So this is a pretty neat little tool to get some quick insights into your data.
Watch the Video
Watch the video on using the Google Sheets Explore tool to see it in action.
I hope you found this article to be helpful. Comment and let me know what you think.
Learn more about Google’s amazing office apps with the Google Cloud Productivity course on Udemy.
